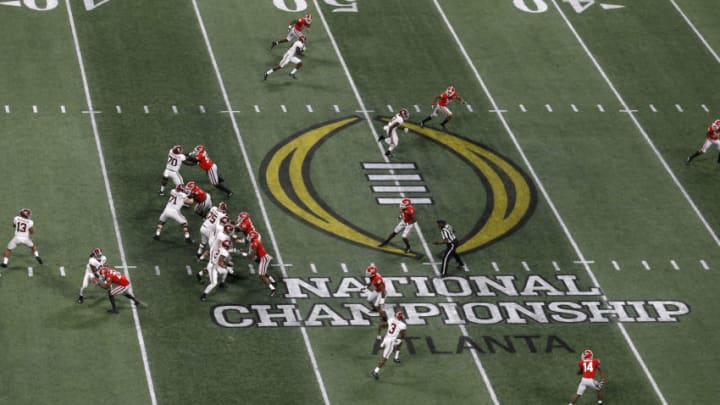
The best and worst national finalists by recruiting averages
In terms of recruiting, Alabama has been at the forefront of building a juggernaut. Four of their rosters hold the top four positions in terms of aggregate five-year recruiting average among national championship game participants. Three of those four teams won the title, while the 2016 edition of the Crimson Tide came a few seconds away from winning three straight between 2015 and 2017.
The 2009 Alabama team that knocked off Texas, on the other hand, had the lowest average recruiting ranking among Nick Saban’s championship squads. That team fell just above the 88-point threshold that has marked the starting point for national title contention.
Only two teams have fallen below that mark. But we will talk about Auburn and Oregon more a little later. Below is the compiled data of each national champion. Working from right to left, the freshman column (F) for each team is from the year listed next to the team name and the four years before that listed date.
Five-year recruiting averages for national championship participants
| R-S | S/R-J | J/R-So | So/R-F | F | TOTAL | |
| 2017 Alabama | 93.25 | 93.65 | 93.73 | 92.54 | 93.76 | 93.39 |
| 2016 Alabama | 93.40 | 93.25 | 93.65 | 93.73 | 92.54 | 93.33 |
| 2015 Alabama | 92.19 | 93.40 | 93.25 | 93.65 | 93.73 | 93.21 |
| 2012 Alabama | 91.20 | 91.39 | 89.95 | 92.19 | 93.40 | 91.55 |
| 2009 Texas | 89.71 | 91.60 | 91.74 | 91.57 | 92.13 | 91.30 |
| 2006 Ohio State | 89.70 | 95.99 | 95.71 | 88.78 | 83.99 | 91.14 |
| 2014 Ohio State | 87.57 | 90.25 | 91.47 | 93.14 | 90.59 | 90.51 |
| 2011 LSU | 91.01 | 89.58 | 91.51 | 89.86 | 90.23 | 90.44 |
| 2011 Alabama | 87.81 | 91.20 | 91.39 | 89.95 | 92.19 | 90.42 |
| 2017 Georgia | 88.51 | 90.97 | 89.74 | 90.77 | 92.27 | 90.37 |
| 2013 Florida State | 89.94 | 89.20 | 90.48 | 92.93 | 89.16 | 90.32 |
| 2007 LSU | 89.84 | 90.30 | 90.82 | 89.75 | 91.01 | 90.32 |
| 2012 Notre Dame | 93.01 | 88.46 | 88.44 | 89.96 | 91.21 | 90.21 |
| 2008 Oklahoma | 91.11 | 90.60 | 89.26 | 86.53 | 91.63 | 89.85 |
| 2008 Florida | 89.69 | 88.90 | 90.58 | 89.45 | 89.31 | 89.58 |
| 2007 Ohio State | 95.99 | 95.71 | 88.78 | 83.99 | 79.66 | 89.43 |
| 2016 Clemson | 89.03 | 88.46 | 88.69 | 89.12 | 90.30 | 89.07 |
| 2006 Florida | 86.15 | 89.96 | 89.69 | 88.90 | 90.58 | 88.97 |
| 2013 Auburn | 86.60 | 88.09 | 89.58 | 90.83 | 89.12 | 88.76 |
| 2015 Clemson | 87.17 | 89.03 | 88.46 | 88.69 | 89.12 | 88.46 |
| 2009 Alabama | 84.77 | 87.49 | 87.81 | 91.20 | 91.39 | 88.32 |
| 2014 Oregon | 87.74 | 89.24 | 88.51 | 87.73 | 87.87 | 88.24 |
| 2010 Auburn | 86.59 | 86.88 | 84.94 | 86.60 | 88.09 | 86.58 |
| 2010 Oregon | 80.53 | 86.09 | 85.08 | 84.51 | 87.74 | 84.65 |
| AVERAGES | 89.27 | 90.40 | 90.14 | 89.85 | 90.04 | 89.93 |
The median recruiting average of 90.26 as derived from the five years of the 247sports composite averages demonstrates the value of elite recruiting. And only the 2010 championship game brings down the average of the two dozen participants between 2006 and 2017 to just under 90 points.
Let’s take a look at that outlier game and assess the best and worst championship games since 2006.
