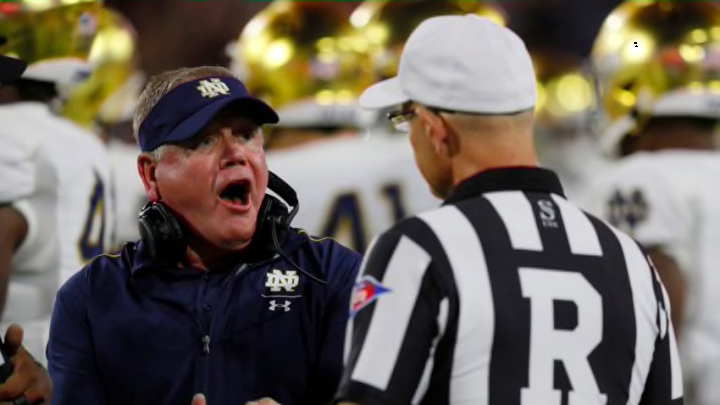
Penalties are a major part of college football and obviously they’re not a good thing. Unfortunately, these teams have found that out the hard way.
Penalties are one of the main things every football coach will harp on avoiding and every armchair coach will scream at the TV about. This is usually totally validated, as penalties can make or break a drive and a game as a whole.
We’ll take a look at the last five years of penalty yardage per game, and then do a deeper dive at every single team’s penalty yardage for 2019 to see if your favorite squad were bad boys or boy scouts.
Note: All raw data was obtained from cfbstats.com and then analyzed for this article.
2015
Top five in penalty yards per game:
1. Navy (26.1)
2. Georgia Tech (27.4)
3. Ball State (35.4)
4. San Jose State (35.7)
5. Old Dominion (36.4)
Bottom five in penalty yards per game:
124. Memphis (75.1)
125. Arkansas State (80.1)
126. Baylor (80.2)
127. Bowling Green (80.2)
128. Miami (84.2)
It warms my college football heart seeing Miami leading the nation in penalties. It just feels right. Get used to seeing Navy and Georgia Tech up top, those Midshipmen know how to stay in line and Paul Johnson kept his Yellow Jackets on the straight and narrow.
2016
Top five in penalty yards per game:
1. Navy (24.4)
2. Connecticut (28.3)
3. Northwestern (29.9)
4. Wisconsin (32.5)
5. Ball State (35.5)
Bottom five in penalty yards per game:
124. Florida State (72.9)
125. Cal (75.8)
126. Oregon (75.8)
127. Marshall (76.8)
128. Baylor (82.2)
Navy again. Also I think UConn this season decided that if it’s going to get blown out every game, it might as well just make it as painless as possible. The result was a 3-9 record where the finished dead last in scoring and their opponents averaged an outrageous 40.5 points per game against the Huskies. Maybe they should throw in a pass interference every once in a while.
2017
Top five in penalty yards per game:
- Minnesota (28.3)
2. Boston College (29.8)
3. Washington (34.2)
4. Georgia Tech (35.8)
5. Old Dominion (35.8)
Bottom five in penalty yards per game:
126. UCLA (75.2)
127. Texas Tech (76.6)
128. Memphis (77.4)
129. South Florida (86.0)
130. Oregon (88.3)
PJ Fleck took over at Minnesota and immediately lead them to the least penalty yardage per game in the country. Row the boat, but please do so gently. Willie Taggart’s one and only season with the Ducks had them the worst in the nation in penalty yardage.
2018
Top five in penalty yards per game:
1. Northwestern (25.9)
2. Navy (30.0)
3. Duke (34.8)
4. Georgia Tech (36.3)
5. Liberty (38.2)
Bottom five in penalty yards per game:
126. Kent State (75.3)
127. Ohio State (75.4)
128. Arizona (75.7)
129. Maryland (79.7)
130. South Alabama (83.5)
Navy and Georgia Tech once again. Northwestern usually runs a tight ship as well. That’s a pun i should have used for Navy. Maryland, following a horrific offseason, was understandably sloppy on the field.
2019
Feast your eyes on this enormous and poorly formatted graph showing every single FBS team’s penalty yardage per game in 2019.
Last month, we looked at how the new kickoff rule changed kickoffs. Next time we’ll use penalties and compare them to wins to see how much of a factor penalty yardage really is. UConn just may be on to something. They’re definitely not, but it’s fun to imagine.
